Read Your Analytics: Contacts, Team and Visitor Sessions
Converge reports numbers in three places: a Contact Analytics dashboard for where your contacts come from, an Employee Productivity dashboard for how fast your team answers, and a per-contact session timeline showing the pages a visitor read before they opened the chat.
Contact Analytics
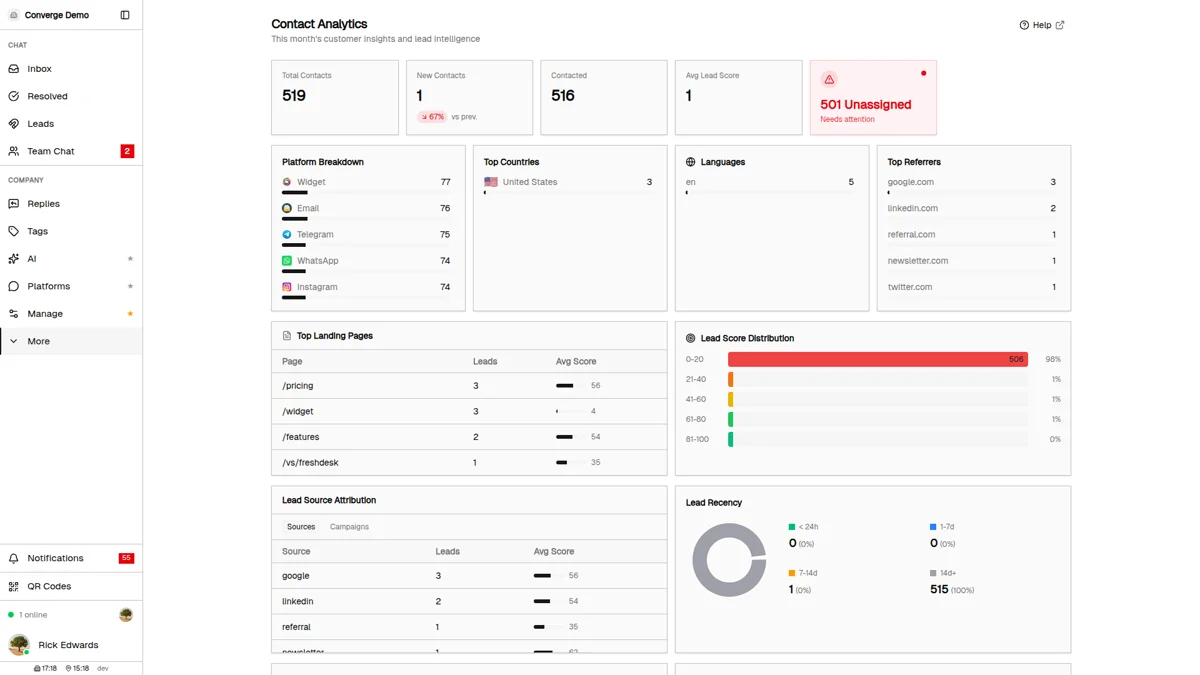
Admin / Owner OnlyOpen the More group at the bottom of the sidebar and click Analytics. Every figure on the page covers the current calendar month so far, and contacts classified as bots are left out of every breakdown.
The KPI row
| Card | What it counts |
|---|---|
| Total Contacts | Every contact your company has, bots excluded |
| New Contacts | Contacts created this month, with the change against the same figure last month |
| Contacted | Contacts that have exchanged at least one message — the rest are still widget visitors |
| Avg Lead Score | Mean score across contacted contacts only, so silent visitors never drag it down |
| Unassigned | Contacts with no agent on them. Turns red once they pass 20% of this month's new contacts |
| Filtered | Contacts identified as bots. The card is hidden when there are none |
The breakdowns below it
- Platform Breakdown, Top Countries, Languages, Top Referrers — the ten largest values in each, with a share of your non-bot contacts
- Top Landing Pages — the page each contact first arrived on, with an average lead score per page. A page with three leads at score 56 is worth more than one with ten leads at score 4
- Lead Score Distribution — five buckets from 0-20 to 81-100
- Lead Source Attribution — UTM sources, with a Campaigns tab for utm_campaign, each with its own average score
- Lead Recency — when each contacted lead was last seen: under 24 hours, 1-7 days, 7-14 days, or 14 days and older
- Contact Conversion — visitors against contacts who wrote in, plus the rate between them
- Message Activity — inbound messages by hour of day, for staffing decisions
Employee Productivity
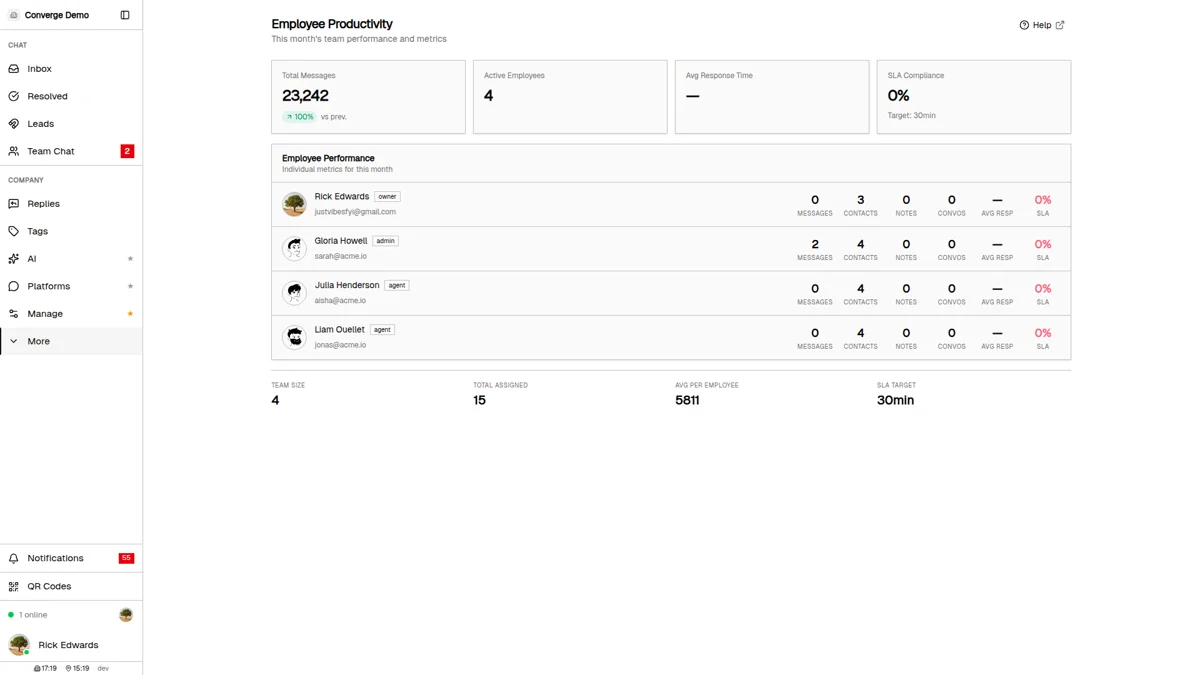
Owner OnlyOpen the More group in the sidebar and click Productivity. Four cards sit across the top, a per-agent table below them, and a totals row at the bottom.
| Card | What it means |
|---|---|
| Total Messages | Every outbound message sent this month, with the change against last month |
| Active Employees | How many people are on the team — not how many are online right now |
| Avg Response Time | Labelled Excellent under a minute, Good under five minutes, Needs work above that |
| SLA Compliance | Share of measured replies that landed inside the first-response target, with the target printed underneath |
The Employee Performance table repeats those numbers per agent: Messages sent this month, Contacts currently assigned to them, Notes edited this month, Convos they resolved this month, then Avg Resp and SLA.
Three things about this page catch people out:
The page runs on two clocks
Messages, Notes and Convos cover the current month. Avg Resp and SLA roll up the last eight weeks, so a bad week keeps showing after the month turns over.
Total Messages includes your automation
AI first-responder answers and auto-replies are outbound messages with no agent attached. They count toward Total Messages and Avg per Employee, but never toward anyone's Messages column — so the two will not add up while automation is answering.
Only a human reply stops the response clock
Response time runs from the customer message that left a conversation waiting until an agent sends a reply. An AI answer in between does not stop it, so a heavily automated inbox can show a slow Avg Response Time while customers are getting instant replies.
The SLA target shown on the card and in the totals row comes from your normal-priority SLA policy's first-response target, falling back to five minutes when you have not set one. Each individual reply is judged against the target for that conversation's own priority. See the SLA guide to change them.
What the Widget Tracks
The widget records exactly one event type:
| Event | When it fires | Data collected |
|---|---|---|
| page_view | Each page load and every SPA route change | URL, page title, referrer hostname, session ID, visitor ID |
Page views arriving from a contact you have marked as a bot are discarded on receipt, which is what keeps crawler traffic out of both the timeline and the Contact Analytics breakdowns.
Privacy & Compliance
Page tracking is designed to collect the minimum data needed to give your support team useful context:
Do Not Track respected
If the visitor's browser sends a Do Not Track signal, no page-view events are recorded or sent.
No third-party cookies
The visitor ID lives in first-party storage on your domain. Nothing is shared with third parties.
First-party data only
Page views are stored on your Converge instance and tied only to the visitor's session and the conversation they eventually open.
Data minimization
Only URL, page title, and referrer hostname are collected. No keystrokes, no form contents, no mouse movement.
Short retention
Raw page-view events are deleted seven days after they are recorded, by a cleanup job that runs nightly at 03:30 UTC.
Note: You should still include analytics disclosure in your site's privacy policy and implement cookie consent banners as required by your jurisdiction.
How Page Tracking Works
On every URL change the widget posts a single page_view to your backend. No batching, no queue, no localStorage buffering — one navigation, one HTTP request.
SPA (Single Page Application) support
If your site is a React, Vue, Next.js or other SPA, the widget detects virtual page changes by:
-
Listening to
popstateevents (browser back/forward) -
Intercepting
history.pushStateandhistory.replaceState
The Session Timeline
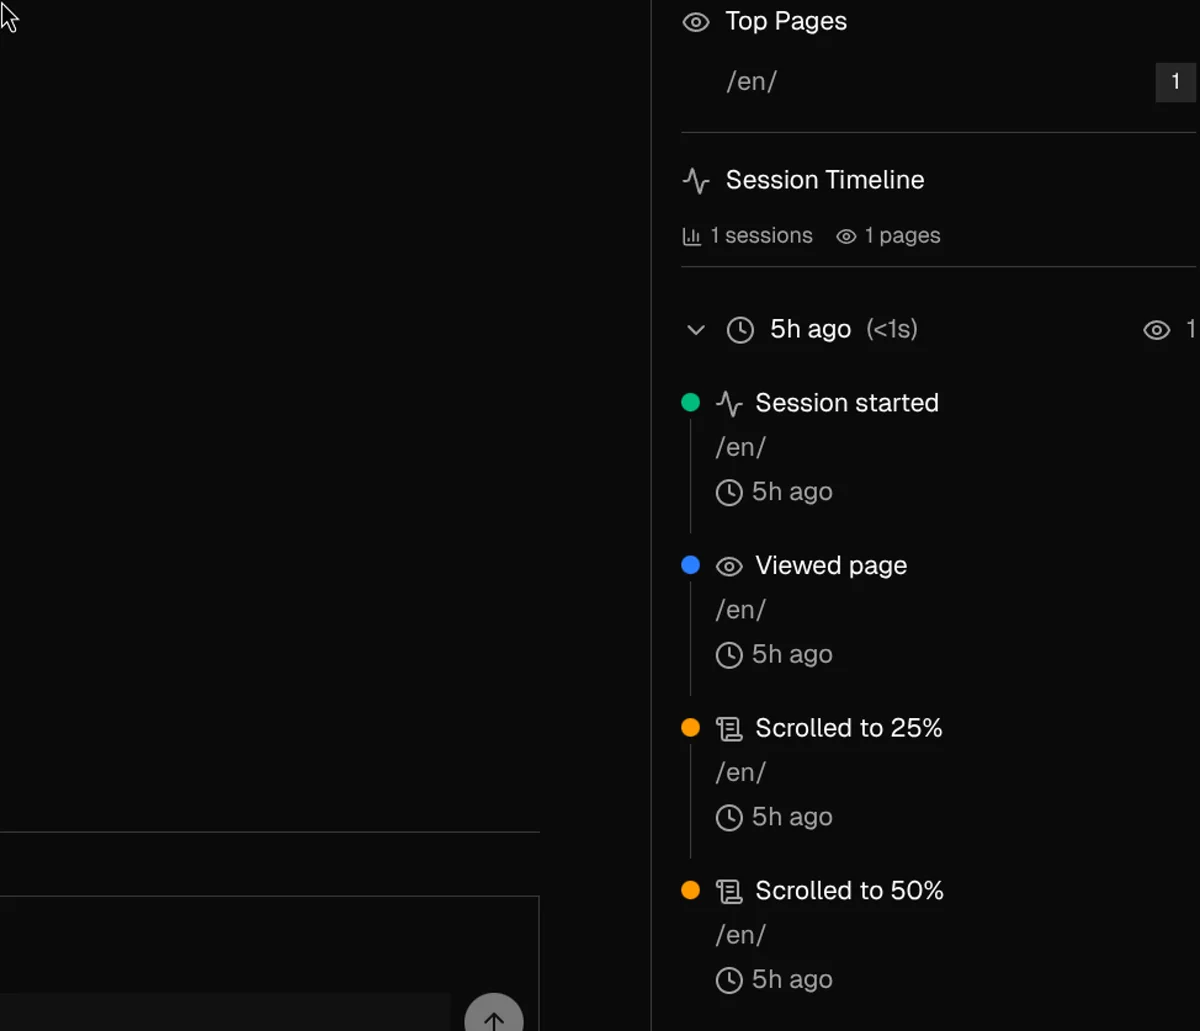
Page views appear inside each contact's panel as a session-grouped timeline, giving your team context the moment a conversation starts.
-
1
Open a conversation with a widget contact
The tab is there for anyone who arrived through the chat widget, and for any contact carrying lead data such as a source page or a UTM tag.
-
2
Click Activity
It sits next to Details along the top of the contact panel on the right.
-
3
Read the summary
Sessions, Page Views and Total Time sit above a Top Pages list and the referrer that sent them.
-
4
Click a session to expand it
Sessions start collapsed, showing only when they began, how long they ran and how many pages they covered. Expanding one lists those pages in order with titles and times.
A session is one browser tab
The session ID lives in the tab's own storage, so opening your site in a second tab starts a second session and closing the tab ends the first one.
Pre-chat browsing is included
Events are matched by visitor ID as well as contact ID, so the pages someone read before they ever typed a message still appear on their timeline.
It is a rolling seven-day window
The panel loads the 100 most recent page views, and events older than seven days have already been deleted. Treat the timeline as live context for an open conversation, not as a history you can audit months later.
Best Practices
Keep page titles meaningful
The timeline displays the page title for each view. Use descriptive <title> tags so the timeline tells a clear story.
Tag your campaigns
Lead Source Attribution reads utm_source and utm_campaign off the landing URL. Links you never tagged land in no row at all, which is the usual reason that panel looks emptier than your ad spend suggests.
Use clean URLs
Avoid tracking-only query strings on internal links — they make the timeline noisier without adding value.
Respect user privacy preferences
Do Not Track is honoured for you. If your site uses a consent banner, hold off loading the widget script until consent is granted.
What's Next?
Explore related features:
- Widget Guide — Install and customize the chat widget on your website
- Leads Guide — Turn tracked visitors into scored leads automatically
- SLA Guide — Set the first-response targets the compliance figures are scored against
- Inbox Guide — Master the unified inbox where the Activity tab lives
Need more help?
Our support team is here for you. Click the chat widget in the bottom right corner to start a conversation.
We typically respond within minutes during business hours.